
If you have experienced a process improvement project or are in the midst of one now, I’m sure this will sound familiar to you.
Hour after hour and meeting after meeting, people list out the things that trouble them. You know the drill, you either list out or start talking about issues and then contagious complaints pile on from person after person. As the list gets longer it seems impossible to dig out of the entangled web, and instead of feeling like you are making progress you feel farther away from the goal. After a few of these same redundant sessions you just come to term that very little is changing.
So how do you avoid that circular waste of time? What is the best way to organize the base requirements to kick off a process improvement project?
To get where you are going, you have to know where you have been.
A great place to start is the SIPOC. Suppliers, Inputs, Process, Outputs, Customers.
If you follow this like a chart, it will lead you through requirements listing.
S – Supplier: The person or system that supplies the information
I – Input: The information being received in
P – Process: What happens with the information
O – Output: The information or item being completed
C – Customer: The person or system that receives the output
First I have a funny one to show how everything can fit this when it is broken down.
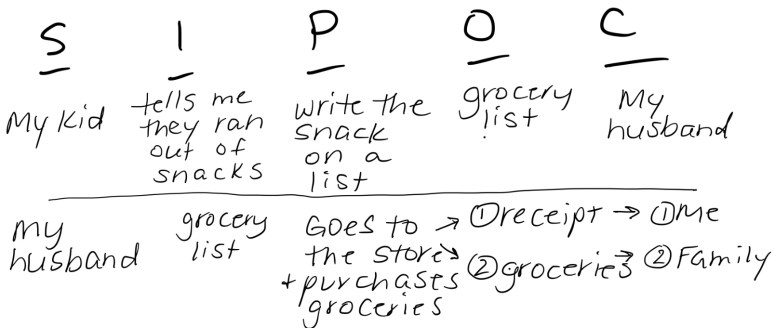

See what I mean? If we were wondering why we end up with so many groceries then the answer is clear! Just kidding, that one was just for fun.
Now let’s say one of your struggles is managing calls for client leads. Your SIPOC may look something like this:
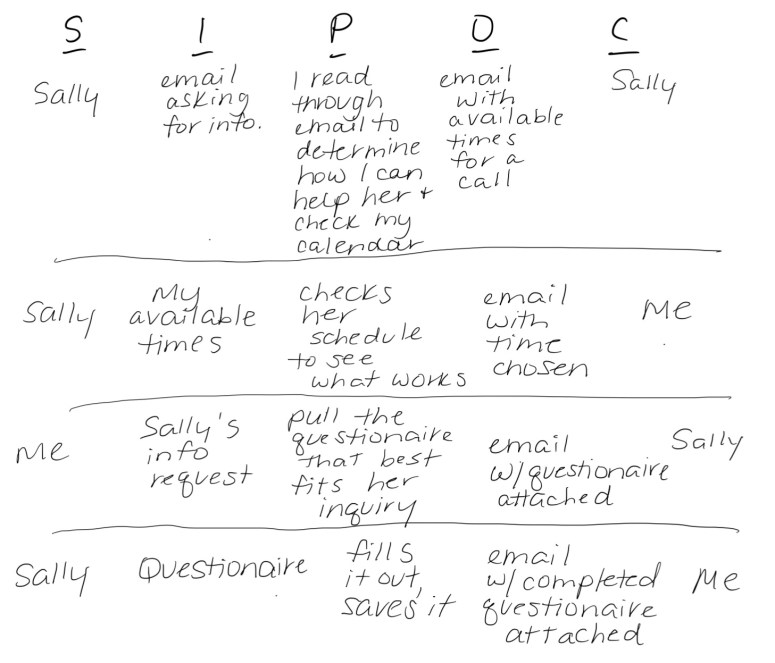
 This SIPOC exercise helps you view the activities. See how there are two times I am using Sally’s info request as my input. When I evaluate this SIPOC it shows me that I could obviously merge those two steps, and it is clear because the input is identical.
When you do this, try not to get too hung up on the acronym. After you get the first line started it should be easy to get on a role with what happens next. This is your business and you best understand the current steps.
Here is a SIPOC for the same type of business with some automation in place:
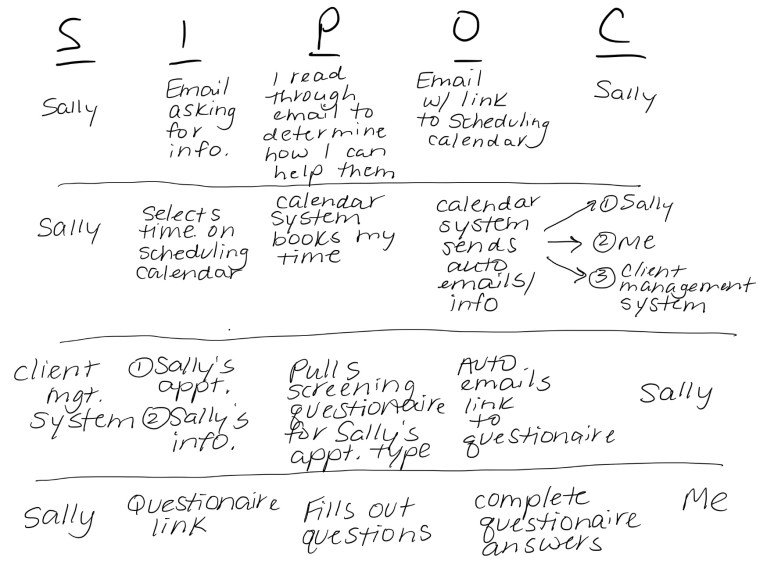
 This one is a tad more complex and in the third row there is an automation by a Client Management System. But still, breaking it down like this makes it easier to understand.
So you can imagine that the chart would be longer as the business is more complex, but this doesn’t have to be a brain draining exercise. In fact, I think this is one of the easiest ways to begin to understand a business’ struggles in order to pick and focus on the biggest pain points for a fresh path forward.
Try this out with a process that you find time consuming and want to change. Then in the comments let me know what you think!
If you found this intriguing and want to learn about ways that I can help improve your business processes, hop on over to like my Facebook page HERE!
Quigley Management Consulting LLC (c) 2018
